SDK Debugging
Debugging Tools
When debugging why a certain user got a certain value, there are a number of tools at your disposal. Here are some troubleshooting tools:
Diagnostics / Log Stream
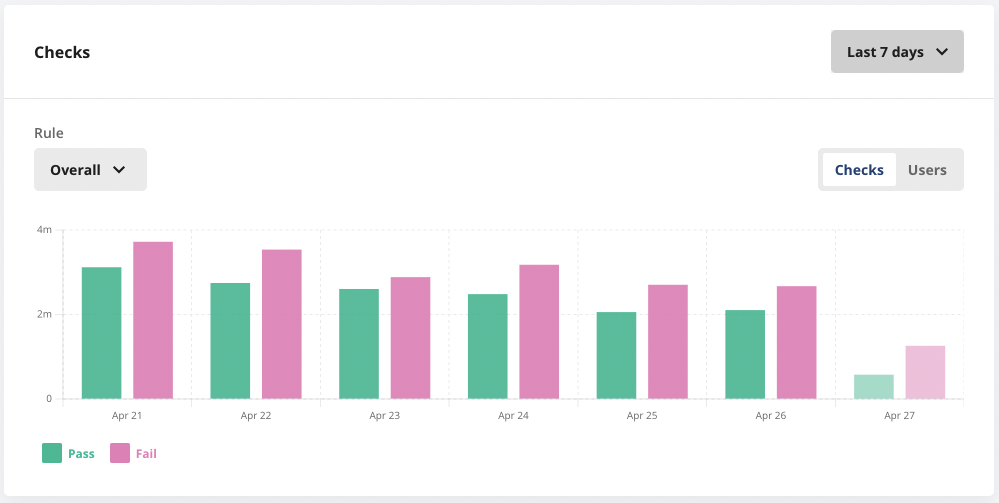
Every config in the Statsig ecosystem (meaning Feature Gates, Dynamic Configs, Experiments, and Layers) has a Setup tab and a Diagnostics tab. The diagnostics tab is useful for seeing higher level pass/fail/bucketing population sizes over time, via the checks chart at the top.
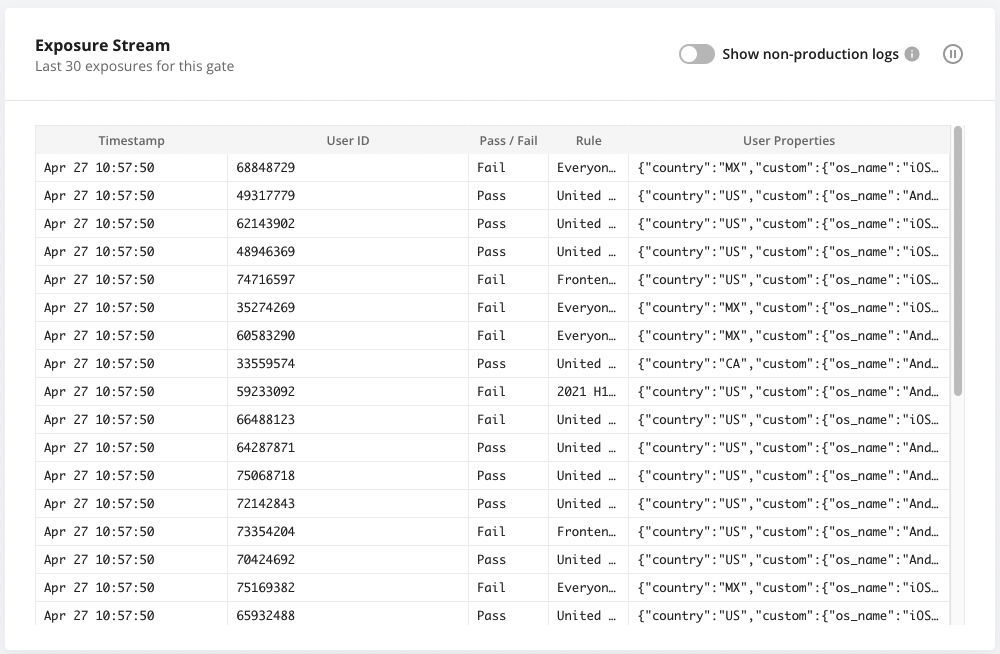
For debugging specific checks, the logstream at the bottom is useful and shows both production and non production exposures in near real time.
Note: To see logs from non-production environments, toggle the "Show non-production logs" in the upper right corner.
Logging Levels and Expected Information
Log-line feedback is one of the simplest tools you have to understand how your SDK is behaving. Our SDKs have multiple log levels to decide what information you'd like to receive:
- Debug: Detailed logs useful for new users onboarding with the SDK and for diagnosing potential issues, such as:
- Messages when a feature gate does not exist
- Tracking process flows within the SDK
- Info: General information about the SDK’s operation, typically relevant to regular usage, such as:
- Messages regarding SDK initialization, including source and version information
- Notifications when the configuration store is populated
- Warning: Logs about unusual events that may impact functionality but are automatically managed and recovered, such as:
- Messages on non critical errors caught by the SDK
- Notifications about reconnection attempts to gRPC services
- Error: Critical logs about issues that severely impact the SDK’s functionality, such as:
- Messages about initialization failures or timeouts
- Notifications indicating gRPC fallback, suggesting gRPC is unavailable or incorrect configuration
Evaluation Details
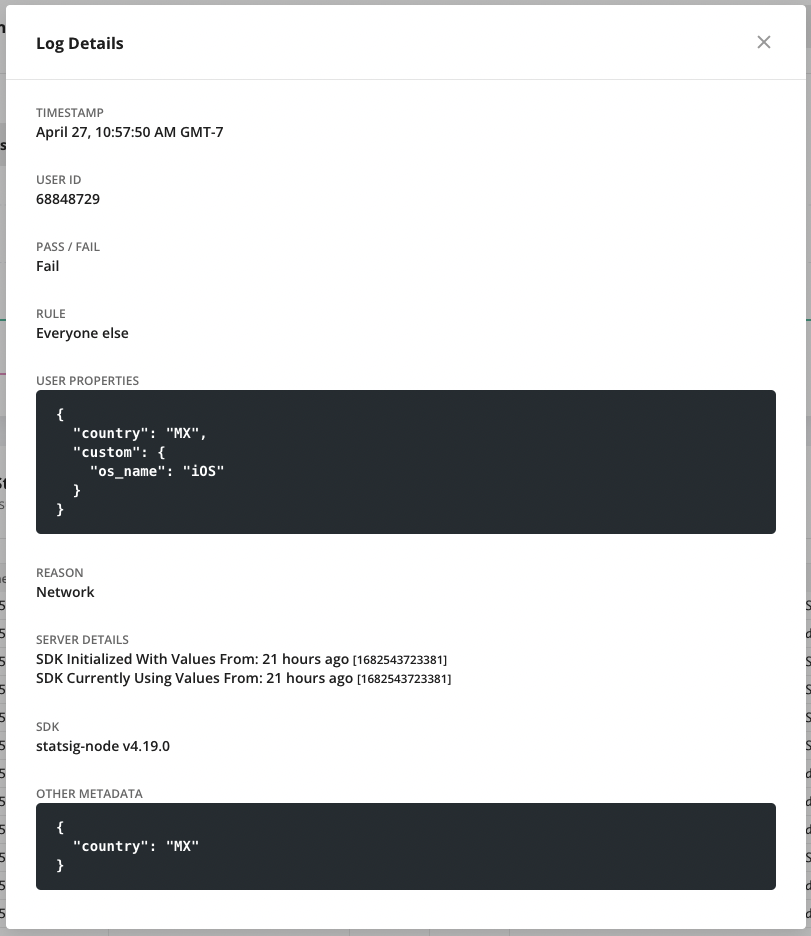
Clicking on a specific exposure shows more details on its evaluation. You can see info like the rule and userID in the exposure stream, and clicking on an individual row shows additional factors like Evaluation Reason, SDK, Server Details and more - all of which can help you debug your setup.
Evaluation Reason
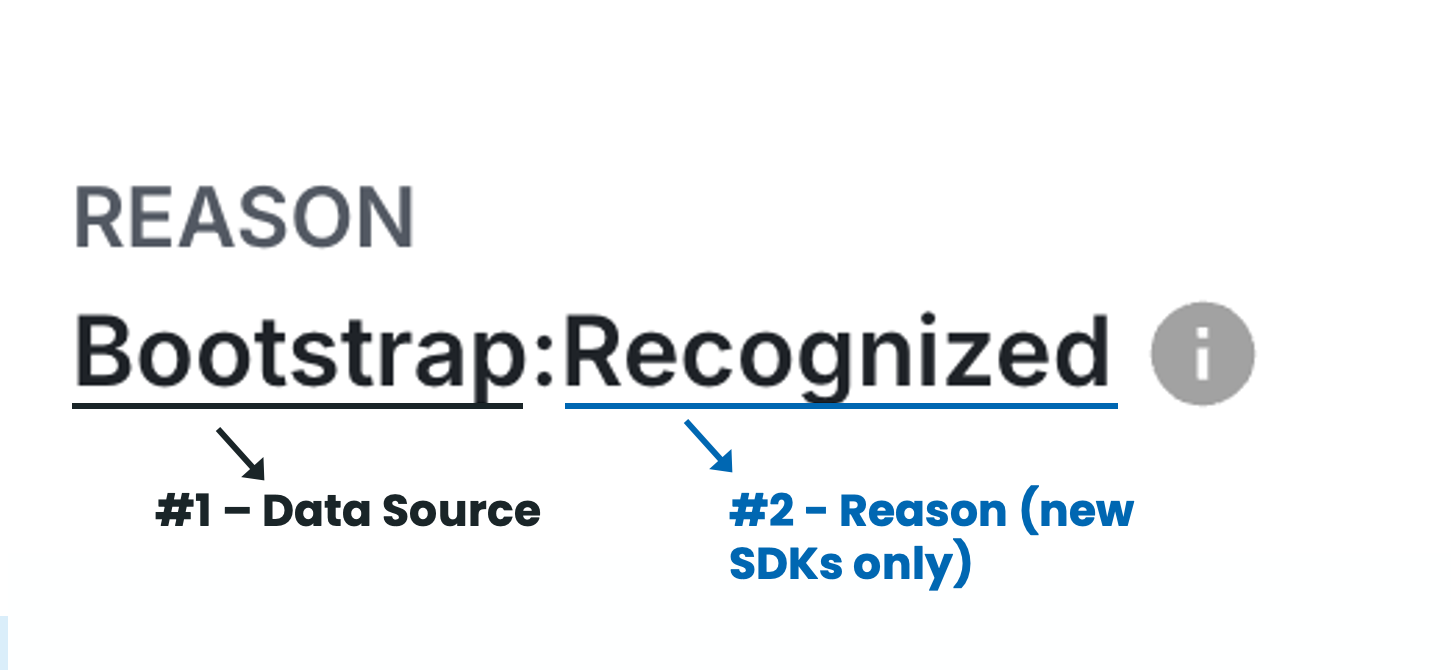
Evaluation reasons are a way to understand why a certain value was returned for a given check. All SDKs provide the Data Source - which is where your Statsig Client/Server instance is getting its data. Newer SDKs also provide a Reason, which lets you know if an individual check was valid or overridden versus how you've initialized. These reasons are intended to be used for debugging and internal logging purposes only, and are sometimes updated in new SDK versions.
- Client SDKs
- Server SDKS
#1. Data Source
For client SDKs, the evaluation state can be:
| Source Name | Description | Type | Debugging Suggestions |
|---|---|---|---|
Network | Fetched at SDK initialization time from Statsig's servers. | Normal | |
Bootstrap | From bootstrapping the client SDK with a set of values (often from a Statsig Server SDK instance, see here). | Normal | |
Prefetch | Fetched from the prefetchUsers API (js-client only), see here. | Normal | |
NetworkNotModified | A request to the Statsig network was successful, but the cached values were already up to date for this user. | Normal | |
Sticky (old SDKs) | Persisted from a sticky evaluation previously. | Normal | |
LocalOverride (old SDKs) | From an override set locally on the SDK via an override API. | Normal | |
Cache | Loaded from the local storage cache for the current user, and network result was not available. | Normal | Not explicitly an error state, but you may be checking a config before initialize returns. |
InvalidBootstrap or BootstrapPartialUserMatch | The user attributes passed to the client SDK are different than those the SDK was initialized with. Typically, the server SDK generating the bootstrap values does not have the same attributes as the client. These are discarded for analysis. | Error | See Fixing InvalidBootstrap |
BootstrapStableIDMismatch | The stableID of the user was different for the user added on the client side than the one you bootstrapped with on the server-side. If your experiment or gate is not StableID based, this can be treated as a warning. These exposures are not discarded for analysis. | Error | See Fixing BootstrapStableIDMismatch |
Error | An unknown error has occurred, and was logged to Statsig servers. | Error | Reach out to us in Slack for support. |
Error:NoClient (js-client-only) | No client was found in your StatsigContext. | Error | You've likely made a call to a Statsig hook outside of a <StatsigProvider>, verify your setup and try again. |
Unrecognized (old SDKs) | The SDK was initialized, but this gate/experiment/config did not exist in the set of values. | Error | Confirm the experiment or gate is configured in the Statsig console and you're using the correct API key. |
NoValues | You've attempted to initialize, but it didn't successfully retrieve values. | Error | You're either calling initializeSync before users have cached values, or your call to initializeAsync has failed (check that your client key is correct!). |
Loading | You've tried to initialize, but it hasn't finished yet. | Error | If you're using initializeAsync, you may need to await it, or otherwise prevent config checks before values are loaded. |
Uninitialized | You haven't attempted to initialize yet. | Error | Ensure you're explicitly calling initializeAsync() or initializeSync(), or check if you've passed any StatsigOptions that could prevent network requests from happening. |
UAParserNotLoaded | You initialized your SDK but disabled UA parsing (likely for performance or memory usage reasons). | Error | Update your targeting to not rely on user agent parsing; only use fields directly set on the user. |
CountryLookupNotLoaded | You initialized your SDK but disabled country lookups (likely for performance or memory usage reasons). | Error | Update your targeting to not rely on IP resolution; only use fields directly set on the user. |
#2. Reason (new SDKs only)
Newer versions of the sdk will contain both the above initialization state and the source of an individual value that was returned.
| Reason Name | Description | Type | Debugging Suggestions |
|---|---|---|---|
Recognized | The value was recognized in the set of configs the client was operating with | Normal | |
Sticky | The value is from keepDeviceValue = true on the method call | Normal | |
LocalOverride | The value is from a local override set on the sdk | Normal | |
Unrecognized | The value was not included in the set of configs the client was operating with | Error | Confirm the experiment or gate is configured in the Statsig console and you're using the correct API key. |
Filtered | The gate was filtered from the /initialize response because the default value for the environment was to fail, and non-existent gates fail by default |
For example: Network:Recognized means the sdk had up to date values from a successful initialization network request, and the gate/config/experiment you were checking was defined in the payload.
If you are not sure why a config was not included (resulting in an "Unrecognized" source), it could be excluded due to Target Apps, or Client Bootstrapping.
#1. Data Source
For server SDKs, the evaluation state can be:
| Source Name | Description | Type | Debugging Suggestions |
|---|---|---|---|
Network | Configurations fetched at SDK initialization time from Statsig's servers. | Normal | |
Bootstrap | From bootstrapping the server SDK with a set of values. | Normal | |
DataAdapter | Values come from the provided data adapter or data store, see here for more. | Normal | |
LocalOverride (old SDKs only) | From an override set locally on the SDK via an override API. | Normal | |
StatsigNetwork | Custom proxy/GRPC streaming has triggered the fallback behavior, thus falling back to Statsig API. | Fallback | Review your proxy setup, your values are up-to-date but not using the expected methodology. |
Uninitialized | The SDK was not yet successfully initialized. | Error | Revisit your Initialization Strategy, as you're checking configs before initialization is complete. |
Unrecognized (old SDKs only) | The SDK was initialized, but this gate/experiment/config did not exist in the set of values. | Error | Confirm the experiment or gate is configured in the Statsig console and you're using the correct API key. |
#2. Reason (new SDKs only)
| Reason Name | Description | Type | Debugging Suggestions |
|---|---|---|---|
LocalOverride | From an override set locally on the SDK via an override API. | Normal | |
| None | Successful evaluation. | Normal | |
Unrecognized | This gate/experiment/config did not exist in the set of values. | Error | Confirm the experiment or gate is configured in the Statsig console and you're using the correct API key. |
Unsupported | The SDK does not support this type of condition type/operator. Usually, this means the SDK is out of date and missing new features. | Error | Update your SDK to the latest version. |
Error | An unknown error occurred during evaluation. | Error | Reach out to us in Slack for support. |
So Network means the sdk was initialized with values from the network, and the evaluation was successful. Network:Unrecognized, means the sdk was initialized with values from the network, but the gate/config/experiment you were checking was not included in the payload.
Evaluation Times
Evaluation times can help you understand the age of the configuration values the SDK is operating with, and if they might be causing unexpected results.
LCUT: Last Config Updated Time
Whenever you modify a gate, config, or experiment, the LCUT (Last Config Updated Time) for your project is updated to the current time. This timestamp indicates the most recent changes that all SDKs should reflect to ensure they are using the latest configurations. If you've made no changes to your project in the last 2 hours, and your SDK is showing an LCUT (on client SDKs) or configSyncTime (on server SDKs) as of 2 hours ago, then you're evaluating the most up to date definition of that gate/experiment. If the LCUT is older than that, your SDK is operating with stale values. Outdated values on a client SDK usually indicate that the user hasn't encountered a recent initialize() or updateUser() call (e.g., they have a long-lived browser tab), which is common and expected. On Server SDKs, it could mean an issue with a data adapter, or a configuration propagation delay.
- Client SDKs
- Server SDKs
| Time Field | Description | SDKs Available In |
|---|---|---|
| LCUT (Last Config Updated Time) | LCUT is the last time a configuration change was made in the Statsig console - this field represents the last config change that the SDK is operating with. | Javascript (incl. React, RN), iOS, Dart. |
| receivedAt | When the SDK received the configuration values for this user. | Javascript (incl. React, RN), iOS, Dart. |
| Time Field | Description | SDKs Available In |
|---|---|---|
| initTime | The last config update time (LCUT) received when the SDK was first initialized (typically, on server startup) | All Server SDKs except Rust |
| configSyncTime | The current last config update time (LCUT) that the SDK is operating with, I.E., the time up until which it has received updates from the network. | All Server SDKs except Rust |
| serverTime | The current time on your server (Date.now()) when an evaluation is made. | All Server SDKs except Rust |
Mocking Statsig / Local Mode
To facilitate testing with Statsig, we provide a few tools to help you test your code without fetching values from statsig network:
-
Local Mode: By setting the localMode parameter to true, the SDK will operate without making network calls, returning only default values. This is ideal for dummy or test environments that should remain disconnected from the network.
-
Override APIs: Utilize the overrideGate and overrideConfig APIs on the global Statsig interface. These allow you to set overrides for gates or configurations either for specific users or for all users by omitting the user ID.
We recommend enabling localMode and applying overrides for gates, configurations, or experiments to specific values to thoroughly test the various code flows you are developing.
For specific SDK implementation: refer to StatsigOptions in the respective SDK documentation.
Client SDK Debugger
It can be useful to inspect the current values that a Client SDK is using internally. For this, we have a Client SDK Debugger. With this tool, you can see the current User object the SDK is using as well as the gate/config values associated with it.
Javascript/React: Via a Chrome Extension https://github.com/statsig-io/statsig-sdk-debugger-chrome-extension
Accounts signing in to the Statsig console via Google SSO are not supported by this debugging tool.
iOS: Available with Statsig.openDebugView(). Available in v1.26.0 and above.
Android: Available with Statsig.openDebugView(). Available in v4.29.0 and above.
| Landing | Gates List | Gate Details | Experiment Details |
|---|---|---|---|
FAQs
For more sdk specific questions, check out the FAQs on the respective SDK pages. If you have more questions, feel free to reach out directly in our Slack Community.
Invalid Bootstrap
This can occur when you are Bootstrapping a Statsig Client SDK with your own prefetched or generated values. The InvalidBootstrap reason is signally that the current user the Client SDK is operating against is not the same as the one used to generate the bootstrap values.
The following pseudo code highlights how this can occur:
// Server Side

userA = { userID: 'user-a' };
bootstrapValues = Statsig.getClientInitializeResponse(userA);

// Client Side

bootstrapValues = fetchStatsigValuesFromMyServers(); // <- Network request that executes the above logic

userB = { userID: 'user-b' }; // <- This is not the same User
Statsig.initialize("client-key", userB, { initializeValues: bootstrapValues });
Users must also be a 1 to 1 match. The SDK will treat a user with slightly different values as a completely different user. For example, the following two user objects would also trigger InvalidBootstrap even though they have the same UserID.
userA = { userID: 'user-a' };
userAExt = { userID: 'user-a', customIDs: { employeeID: 'employee-a' }};
BootstrapStableIDMismatch
This error is similar to InvalidBootstrap - but isolated to the StableID of the user. In a StableID based experiment or Gate, this is a meaningful issue - as we will bucket users based on StableID, meaning their buckets could be incorrect. A common situation that this occurs in is when you use a user object on both the client and server side that doesn't have an explicitly set StableID: client SDKs will generate a StableID for the user, but the server SDK will not - creating a mismatch.
A similar example to the InvalidBootstrap can cause this issue:
// Server Side

userA = {};
bootstrapValues = Statsig.getClientInitializeResponse(userA);

// Client Side

bootstrapValues = fetchStatsigValuesFromMyServers(); // <- Network request that executes the above logic

userB = { stableID: '12345' }; // <- This will generate a StableID mismatch, as the server-side user does not have a StableID.
Statsig.initialize("client-key", userB, { initializeValues: bootstrapValues });
As mentioned above, Statsig's client-side SDKs will also generate a StableID for the user if one is not provided, so an empty user object could trigger this error - even when the server and client-side user objects are the same:
userC = {}; // <- despite being the same as userA, the client SDK will generate a StableID for userC, causing a mismatch.
Statsig.initialize("client-key", userC, { initializeValues: bootstrapValues });
Environments
SDKs get the environment configurations from initialization options. If no environment is provided, the SDK will default to the production environment.
If you are wondering why a certain user is not passing an environment-based condition and what you SDK is initialized with, you can check the user properties in any of the log streams.
The statsigEnvironment property will show you the environment the SDK is operating in.
Maximizing Event Throughput
This is currently only applicable to Python SDK v0.45.0+
The SDK batches and flushes events in the background to our server. When the volume of incoming events exceeds the SDK's flushing capacity, some events may be dropped after a certain number of retries. To reduce the chances of event loss, you can adjust several settings in the Statsig options:
- Event Queue Size: Determines how many events are sent in a single batch.
- Increasing the event queue size allows more events to be flushed at once, but it will consume more memory. It's recommended not to exceed 3000 events per batch, as larger payloads may result in failed requests.
- Retry Queue Size: Specifies how many batches of events the SDK will hold and retry.
- By default, the SDK keeps 10 batches in the retry queue. Increasing this limit allows more batches to be retried, but also increases memory usage. Tuning these options can help manage event volume more effectively and minimize the risk of event drops.