Topline Alerts
Topline Alerts notify you when key metrics shift beyond a threshold or change in value. They are available in Statsig Cloud and Statsig Warehouse Native.
Statsig currently supports three types of Topline Alerts:
| Alert Condition Type | When to Use | Example |
|---|---|---|
| Threshold | Use when you want to stay above or below a fixed number. | “Alert me when P90 latency spikes above 15 seconds.” |
| Change | Use when the size of the change matters. | “Alert me when hourly P90 latency increases by 10 seconds.” |
| Change (%) | Use when the relative size of the change matters. | “Alert me when hourly P90 latency increases by 50%.” |
Creating a Topline Alert
Step 1: Navigate to Topline Alerts
Go to Analytics → Topline Alerts in the product menu.
Step 2: Create a New Alert
Click +Create and give the new alert a name.
Step 3: Select the Event or Metric Source
Pick the data you want to monitor.
- On Statsig Warehouse Native: Select a Metric Source, filter, and group by your desired dimensions.
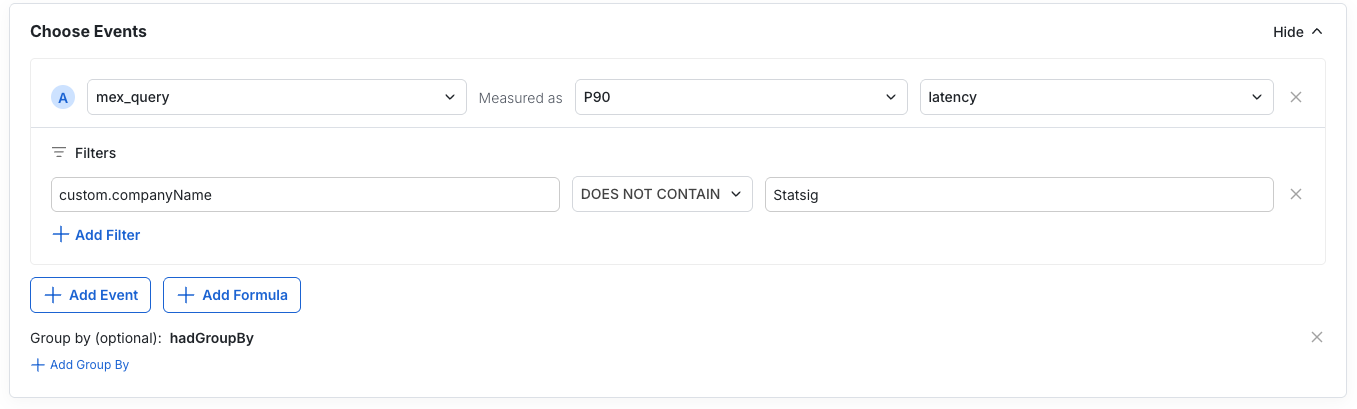
- On Statsig Cloud: Select the event, aggregation, filters, and group by conditions for this alert.
Example: We're going to set set up an alert to monitor P90 latency of mex_query events. We're going to filter out internal employee queries and group by an additional dimension called hadGroupBy.
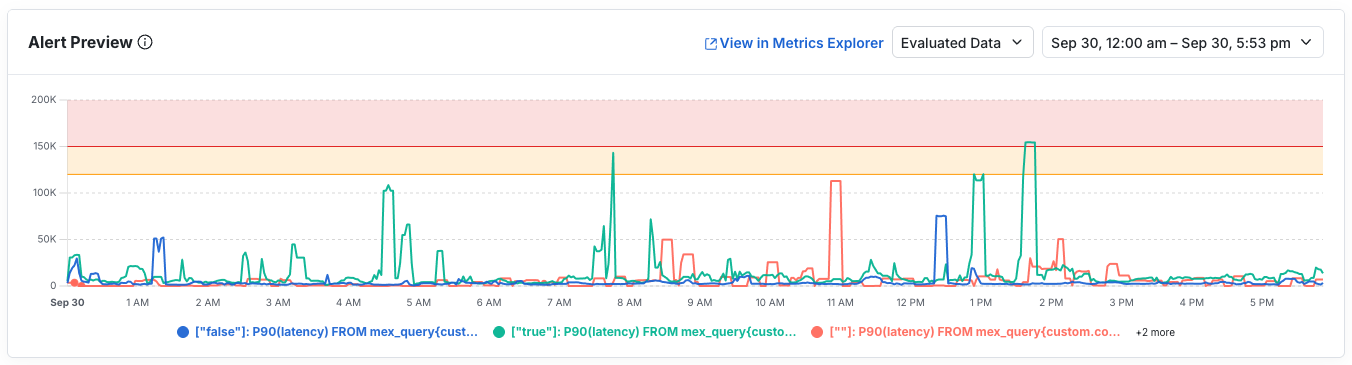
Step 4: Review your metric in Alert Preview
The preview shows how your metric is trending with the current setup. Confirm values look correct, or open the metric in Metrics Explorer for deeper analysis.
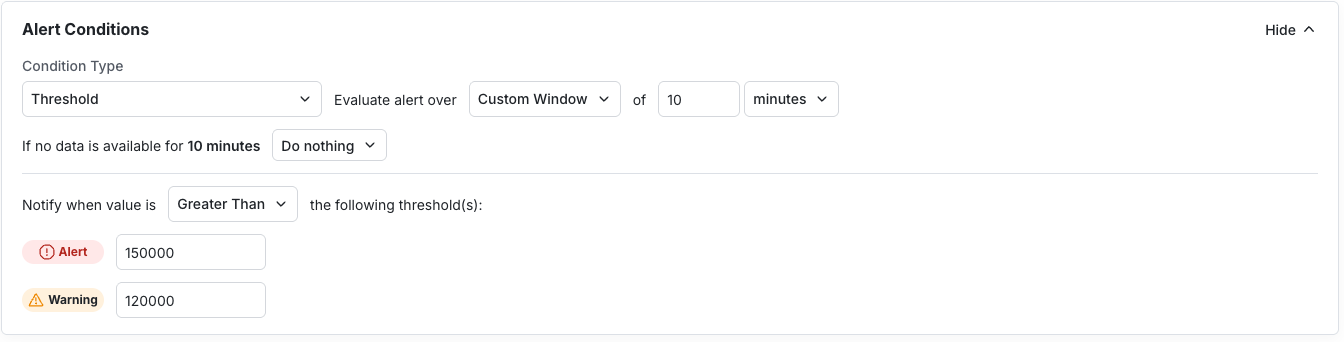
Step 5: Set Alert Conditions
The preview will update along with your setup changes. Define the:
- Condition type (threshold, change, change %)
- Directionality
- "Alert" / "Warn" values
- Evaluation window
- On Warehouse Native: Define the evaluation frequency, lookback, and max delay. These will influence the cost of evaluating this alert in your warehouse.
Step 6: Add Notifications
Notifications go to email, the Statsig Console, and Slack if connected. Project-wide defaults are available in the Settings menu.
- Write a message users will receive when the alert fires (keep it clear and actionable)
- Add subscribers
- Set the alert priority
- Configure re-notification rules if you want alerts to resend while the condition holds
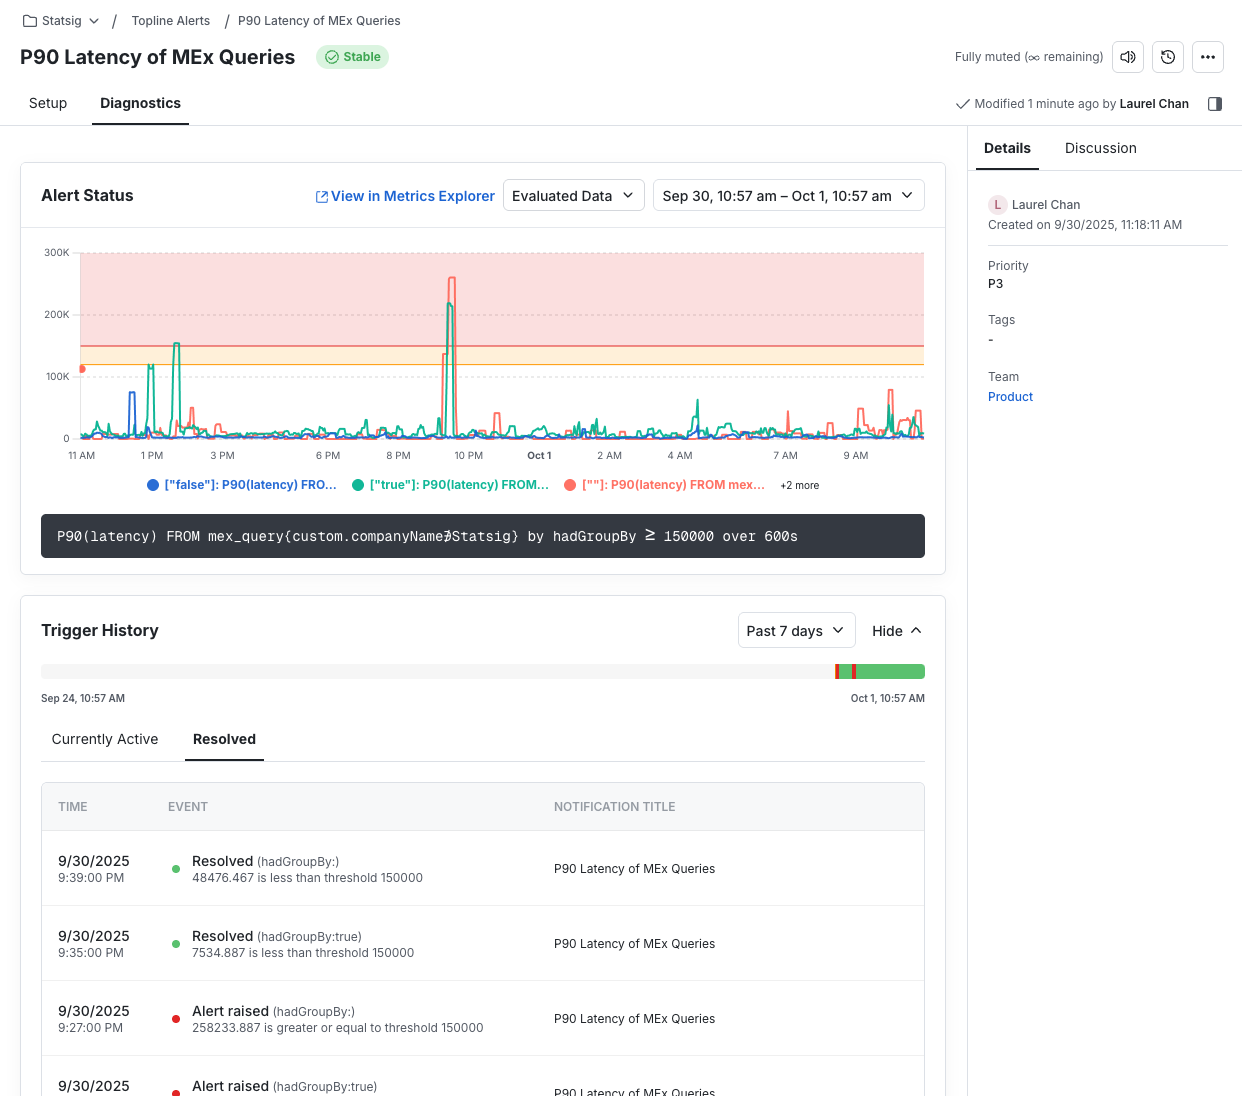
Step 7: Save & Monitor
Save the alert. When it fires, it will appear at the top of the page.
The Diagnostics tab will show past activity of the alert. This includes trigger history with options to inspect samples, launch into Metrics Explorer, or mute.
Interested in more?
- Create log-based alerts to catch issues directly from event logs
- Use rollout alerts to monitor metrics in the context of feature gates and experiments
- Set up team Slack notifications to keep your alerts visible where your team works.