Logs Explorer
Logs Explorer provides a way for you to search and analyze all of your product’s logs in one place. It works for logs, traces, and ingested events, so you can use the same interface whether you’re debugging infra issues or investigating product event streams.
- Searching: Slice logs down to only what’s relevant (by service, host, status code, etc.)
- Grouping: Aggregate logs by dimensions like region, status, or browser.
- Visualization: Plot log groupings over time to spot spikes, regressions, or anomalies instantly.
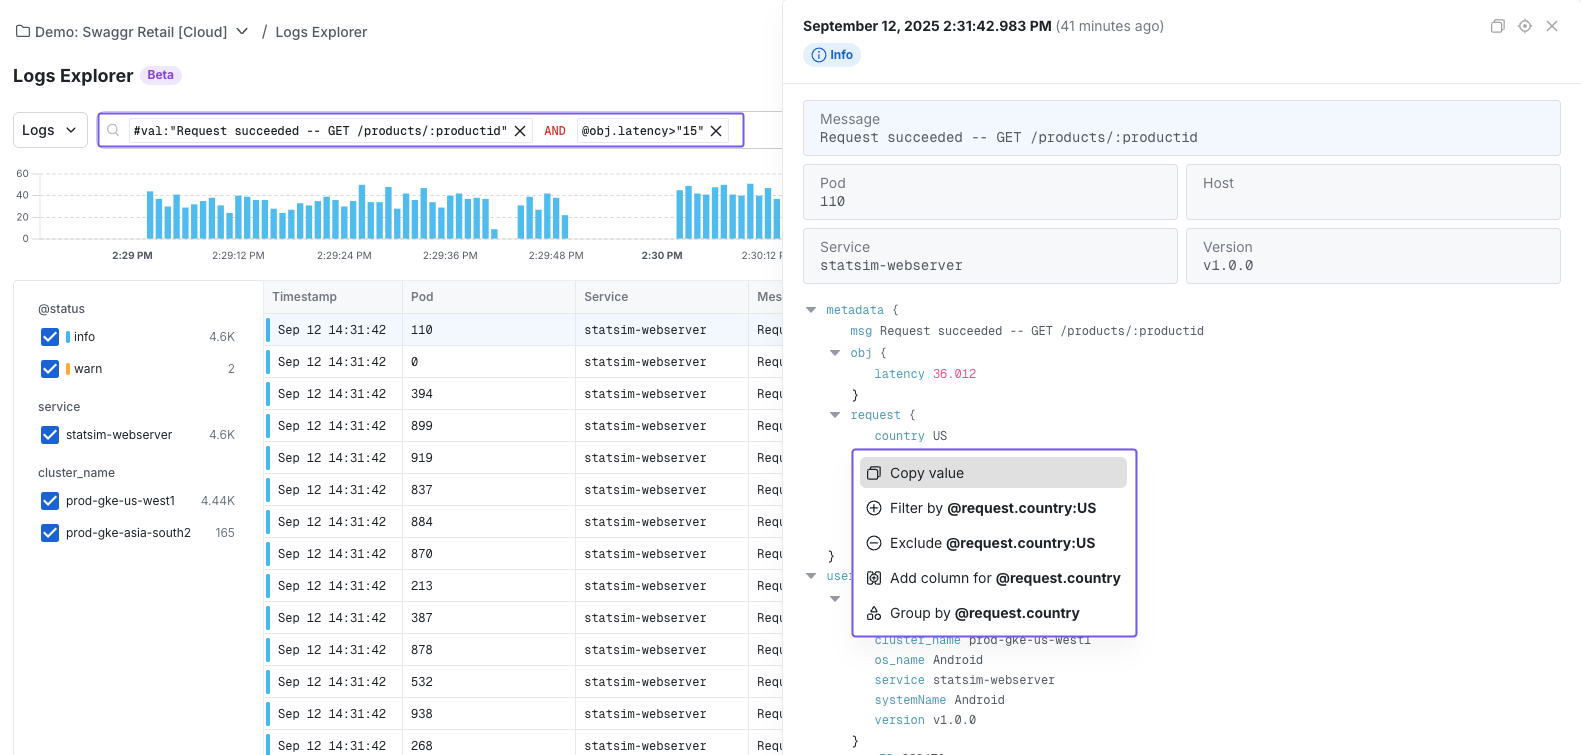
Searching in Logs Explorer
You can find the logs you care about by:
- Writing queries: Run custom searches to zero in on specific log entries.
- Using the query builder: Point-and-click to construct filters without syntax overhead.
Getting Started with Log Explorer
To get started with Log Explorer, follow the OTEL onboarding guide to set up log ingestion. Once that's ready, you can navigate to Infra Analytics → Log Explorer in the Statsig sidebar to begin exploring your logs.
You can also use Logs Explorer in Events Mode to search and analyze your existing Statsig Events — no additional instrumentation needed.
info
Interested in Traces? Reach out in Slack to get access.